

Customer Analytics: What it is & How it Works
Customer service analytics is the process of collecting, measuring, and analyzing customer interactions to improve support performance, customer satisfaction, and business outcomes. It uses data from channels like live chat, email, phone, social media, reviews, and surveys to understand customer needs and how well your team is meeting them.
Types of Customer Analytics (Descriptive Version)
1. Customer Experience Analytics
Customer experience analytics focuses on analyzing how customers feel and what they experience across all touchpoints. It examines satisfaction levels, sentiment, and overall perception of the brand.
This includes data from surveys such as CSAT, NPS, and CES, as well as feedback from reviews, emails, chats, and calls. It also processes emotional cues from voice and text interactions using sentiment analysis tools. The goal is to understand the quality of the experience customers receive at every stage.
2. Customer Journey Analytics
Customer journey analytics tracks and analyzes the steps customers take as they interact with a business. It maps out all touchpoints such as websites, apps, email, social media, and customer support and studies how customers move through these stages.
It identifies drop-off points, engagement paths, and common behavioral patterns. This type of analytics provides a complete view of how customers progress from awareness to purchase and beyond.
3. Customer Engagement Analytics
Customer engagement analytics measures how actively customers interact with a brand, product, or content. It analyzes website visits, app usage, content consumption, email interactions, feature usage, chat activity, loyalty program participation, and repeat interactions.
It highlights the depth and frequency of customer involvement and shows which activities receive the most attention.
4. Customer Retention Analytics
Customer retention analytics focuses on understanding long-term customer behavior and loyalty. It examines churn rate, renewal behavior, repeat purchases, customer lifetime value, and activity patterns over time.
It tracks signals that suggest declining interest as well as behaviors linked to strong loyalty. This type of analytics helps identify which customer groups remain active and which are at risk of leaving.
7 Important Metrics for Analyzing Customer Performance
1. Customer Lifetime Value (CLV)
Measures the total revenue a customer is expected to generate throughout their relationship with your business.
2. Customer Retention Rate
Tracks how many customers continue buying or using your service over a set time period.
3. Customer Churn Rate
Shows the percentage of customers who stop purchasing or cancel their subscription within a given timeframe.
4. Net Promoter Score (NPS)
Evaluates customer loyalty by measuring how likely customers are to recommend your brand to others.
5. Customer Satisfaction Score (CSAT)
Indicates how satisfied customers are after interacting with your product, service, or support team.
6. Customer Engagement Score
Measures how actively customers interact with your brand through actions like logins, feature usage, clicks, and repeat visits.
7. Average Order Value (AOV)
Calculates the average amount customers spend per transaction, showing the purchasing strength of each customer.
5 Benefits of Data Analytics on Customer Service
1. Faster and More Accurate Issue Resolution
Analytics identifies repeated problems, common patterns, and root causes, allowing support teams to resolve issues quickly and reduce handling time.
2. Improved Customer Satisfaction
By analyzing feedback, sentiment, and interaction history, teams can adjust processes, deliver better experiences, and boost satisfaction scores.
3. Better Resource Planning
Data highlights peak hours, ticket trends, and workload distribution, helping businesses schedule staff and allocate resources more effectively.
4. Reduced Customer Churn
Analytics reveals early warning signs, such as negative sentiment or repeated complaints, allowing businesses to intervene before customers leave.
5. Personalized Customer Support
Customer data shows preferences, past behavior, and previous issues, enabling support teams to deliver tailored and relevant responses.
What SalesGroup Analytics Contains
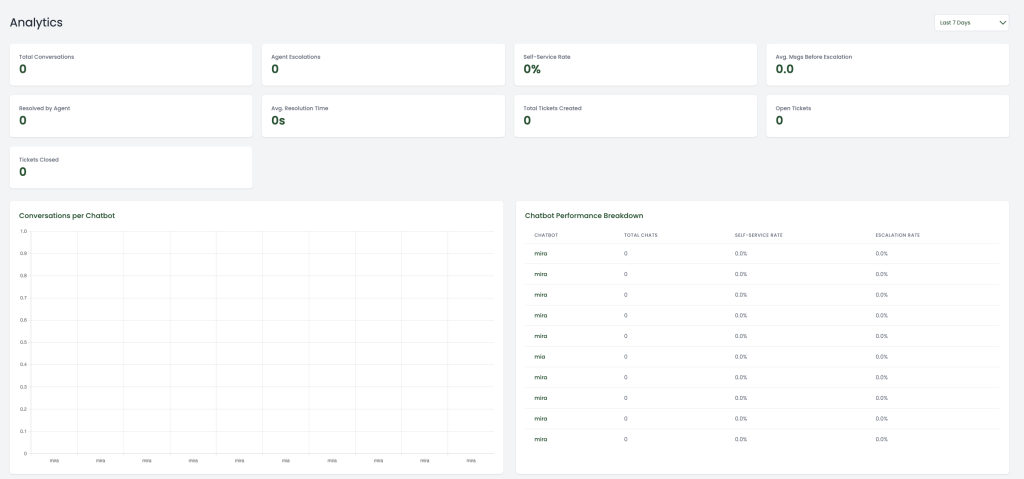
1. Key Support Metrics (KPIs)
SalesGroup Analytics tracks all core customer service indicators in one place, including:
- Total Conversations
- Agent Escalations
- Self-Service Rate
- Average Resolution Time
- Tickets Created & Tickets Closed
- Open Tickets
These KPIs help you instantly understand the health of your support operations.
2. Chatbot Conversations Overview
A visual chart showing:
- How many conversations each chatbot handles
- Usage trends over time
- Traffic peaks and dips
This helps you know when customers are most active and which chatbot is performing best.
3. Chatbot Performance Breakdown
A detailed table that displays:
- Total chats handled per chatbot
- Self-service rate per chatbot
- Escalation rate per chatbot
This gives clarity on which chatbot is effective, where to optimize flows, and what needs improvement.
4. Ticket Management Insights
Analytics include:
- Tickets by Status (open, closed, pending)
- Tickets by Priority (low, medium, high, critical)
This helps teams monitor workload, meet SLAs, and prioritize important issues.
Benefits of SalesGroup Analytics
✔ Full Visibility Into Customer Support
You see exactly what’s happening across your chatbots and agents in real time.
✔ Improve Self-Service Efficiency
Identify which chatbot solves issues the fastest and where customers get stuck — so you can improve automation.
✔ Reduce Support Costs
A higher self-service rate means fewer escalations, less workload, and faster responses.
✔ Optimize Team Performance
Track agent load, ticket status, and resolution time to ensure your support team stays productive.
✔ Better Decision-Making
With clear data on conversations, tickets, performance, and trends, you can make informed improvements that boost customer experience.
Conclusion
In summary, SalesGroup Analytics gives businesses a complete, real-time view of how their support ecosystem is performing.
By combining conversation insights, chatbot effectiveness, and ticket management data in one place, teams can make smarter decisions, improve customer satisfaction, and scale support without increasing workload.
It’s everything you need to understand what’s working, what needs attention, and how to deliver faster, more efficient custom
